Assignment5
Due on 3/3 11:59 pm (PST): See Submission for details
GitHub Classroom link for 154B: https://classroom.github.com/a/bDGsMxaa
GitHub Classroom link for 201A: https://classroom.github.com/a/HZ0NCDOx
Table of Contents
- Introduction
- Research Question
- Workloads
- System under simulation
- Step I: A comparison between syscall emulation and full system
- Experimental Setup
- Analysis and Simulation
- Hints
- Submission
- Grading
- Academic Misconduct Reminder
Introduction
In this assignment, you will explore the design space of virtual memory translation caches. You will:
- Learn how different TLB configurations affect system performance
- Understand the tradeoffs between TLB size and page walk cache configurations
- Analyze how different workloads stress the virtual memory system differently
Virtual memory translation is a critical component of modern computer systems. Every memory access requires translating a virtual address to a physical address. To make this translation fast, systems employ translation lookaside buffers (TLBs) and page walk caches.
Research Question
Should we allocate area to a TLB or to the page walk cache?
To answer this question, you will need to simulate different configurations of TLBs and page walk caches and measure their impact on system performance.
Workloads
You will use two different workloads for this assignment:
-
Breadth-first search (BFS)
- Memory intensive with irregular access patterns
- Large working set size
- Available as
bfs_x86_runorbfs_fs_run
-
Matrix multiplication with blocked layout (MM-Block-IK)
- Regular memory access patterns
- Moderate working set size
- Available as
mm_block_ik_x86_runormm_block_ik_fs_run
Both workloads are available in syscall emulation (SE) and full system (FS) modes.
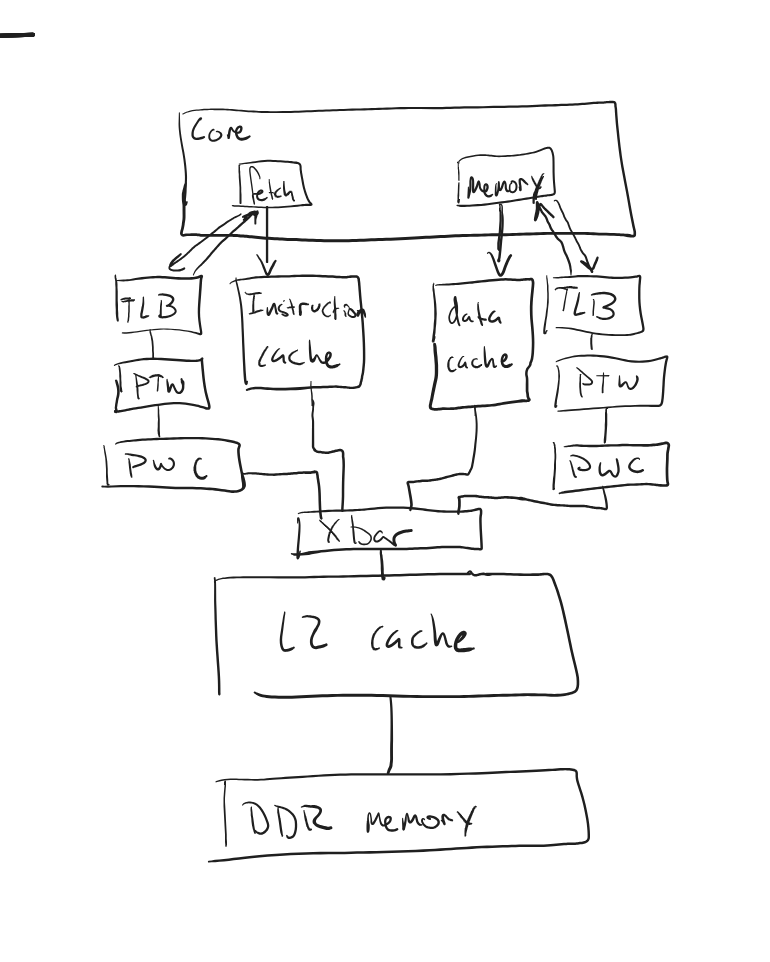
System under simulation
The system you are simulating looks something like the picture below:
Step I: A comparison between syscall emulation and full system
Before exploring the main part of this assignment, we will look at the differences between running our workloads in syscall emulation (SE) mode versus full system (FS) mode.
SE mode simulates only the application, intercepting system calls and handling them directly. This provides:
- Faster simulation time
- Simpler setup
- Less realistic system behavior
FS mode simulates the entire operating system. This provides:
- More realistic virtual memory behavior
- Complete system effects
- Slower simulation time
Let’s look at the differences when running in SE and FS modes.
Run in SE mode
The run script provided (run.py) will run the workload in SE mode by default.
gem5 run.py bfs
gem5 run.py mm_block_ik
Run these workloads and note the number of instructions, the time, and the IPC.
Run in FS mode
We have provided Workloads that allow you to run the exact same binary in FS
mode. However, before you can run the binary, you have to boot the operating
system. Since this would take a very long time (an hour or more) to run in
detailed simulation mode, the run script will use a fast-forward mode to boot
the OS. After the OS is booted, and the binary is copied from your host system
into the guest system, the run script will switch to detailed simulation mode
and run the workload. The code in the exit_event_handler function handles the
transition from fast-forward to detailed simulation, if you are interested in
the details.
You can see the output of the boot process by either watching the terminal output file or by connecting to the gem5 terminal. To watch the output file, you can run:
tail -f m5out/<path to output>/board.pc.com_1.device`
To connect to the gem5 terminal, you first need to build the m5term tool:
cd util/term
make
Then you can run:
./m5term <port>
The default port for the gem5 terminal is 3456, but if you run more than one simulation at a time the port will be different. The port number is printed to the terminal when you run the simulation.
Now you can run the workloads in FS mode:
gem5 run.py bfs --fs
gem5 run.py mm_block_ik --fs
Just like in SE mode, when the application begins the region of interest, the statistics are reset. When the region of interest ends, the statistics are dumped to the output file. So, when you compare the statistics between SE and FS modes, you are comparing the same region of interest.
Compare SE and FS modes
- What is the difference in the number of instructions simulated between SE and FS modes for each workload? Why does it vary?
- What is the difference in the number of TLB misses between SE and FS modes for each workload? Why does it vary?
- What is the difference in IPC between SE and FS modes for each workload?
- What are the differences in PTW memory accesses and dptw cache accesses between SE and FS modes? What can you conclude about page table walks in SE mode by looking at these statistics?
Look at the Hints section on where to get started on reading the
stats.txt.
Experimental Setup
You will use the following configuration for your experiments:
- Board: X86Board
- Memory: DDR4 with 3GB capacity
- Cache Hierarchy: Two configurations
- SmallPWCHierarchy: Small page walk cache configuration
- LargePWCHierarchy: Large page walk cache configuration
- TLB Configurations:
- 16 entries (small)
- 32 entries (large)
- Clock frequency: 3 GHz
The provided run.py script allows you to configure these parameters.
Analysis and Simulation
Complete the following steps and answer the questions for your report.
Step II: Hypothesis: Understanding the Virtual Memory System
Before running any experiments:
- What do you expect to happen to performance as you increase the TLB size? Why?
- What do you expect to happen to performance as you increase the page walk cache size? Why?
- Do you expect increasing the TLB size to have a larger impact on performance than increasing the page walk cache size? Why or why not? Use AMAT to justify your answer (Look at the Hints section for more on calculating AMAT).
Step III: Basic Performance Analysis
Run both workloads with the small TLB (16 entries) and small page walk cache configuration.
- What is the TLB miss rate for each workload?
- What is the average page walk latency for each workload, i.e., what is the the AMAT of a TLB miss?
- What percentage of execution time is spent handling TLB misses? (Hint: compare the performance of SE mode and FS mode to get an approximation of the time spent handling TLB misses.)
Step IV: Design Space Exploration
Run experiments varying both TLB size and page walk cache configuration.
- For each workload, what is the performance impact of:
- Doubling the TLB size (16 to 32 entries)
- Using the large page walk cache configuration
Answering the Research Question
Using the data from your experiments, answer the research question:
- Should we allocate area to a TLB or to the page walk cache?
Assume that the area difference of the larger TLB and the larger page walk cache is the same. (This is approximately true for the configurations we are using since the TLB will be fully associative and requires a lower access time.)
Next Steps (Required 201A, Extra Credit 154B)
- How would your conclusions change if the workloads used huge pages (2MB) instead of regular 4KB pages?
- What are the characteristics of the workloads which cause the performance impact of address translation to be different between the two workloads?
Hints
Useful stats
simSeconds
The hits, misses, and total latency for the data TLB’s (DTB) page walk cache. You can divide the latency by the number of misses to get the average per miss latency (i.e., AMAT). The latency is given in ticks not cycles or seconds.
board.cache_hierarchy.dptw_caches.overallHits::total
board.cache_hierarchy.dptw_caches.overallMisses::total
board.cache_hierarchy.dptw_caches.overallMissLatency::total
The TLB stats (hits, misses, accesses). Feel free to ignore the intruction TLB (itb).
SE:
board.processor.cores.core.mmu.dtb.rdAccesses
board.processor.cores.core.mmu.dtb.wrAccesses
board.processor.cores.core.mmu.dtb.rdMisses
board.processor.cores.core.mmu.dtb.wrMisses
FS:
board.processor.switch.core.mmu.dtb.rdMisses
board.processor.switch.core.mmu.dtb.wrMisses
board.processor.switch.core.mmu.dtb.rdAccesses
board.processor.switch.core.mmu.dtb.wrAccesses
The accesses by the page table waker to memory and to the L2 cache
board.memory.mem_ctrl.dram.bwTotal::processor.switch.core.mmu.dtb.walker
board.cache_hierarchy.l2-cache-0.overallAccesses::processor.switch.core.mmu.dtb.walker
board.cache_hierarchy.l2-cache-0.overallMisses::processor.switch.core.mmu.dtb.walker
board.cache_hierarchy.l2-cache-0.overallHits::processor.switch.core.mmu.dtb.walker
Submission
You will submit this assignment via GitHub Classroom.
- Accept the assignment by clicking on the link provided in the announcement
- Create a Codespace for the assignment on your repository
- Fill out the
questions.mdfile - Commit your changes
Make sure you include both your runscript, an explanation of how to use your
script, and the answers to the questions in the questions.md file.
Explanation of How to Use Your Script
Include a detailed explanation of how to use your script and how you use your
script to generate your answers. Make sure that all paths are relative to this
directory (virtual-memory/).
- Include a description of what the script does
- Include the path to the script
- Include any parameters that need to be passed to the script
- Include example commands used to gather data
- These should be able to be copy-pasted and run without modification
- Include any required files in your repository
Grading
- 25 points gem5 runscript and explanation of how to use your script
- 50 points for the questions in the report
- 25 points for the research question
- 10 points for the next steps
Academic Misconduct Reminder
You are required to work on this assignment individually. You may discuss high level concepts with others in the class but all the work must be completed on your own.
Remember, DO NOT POST YOUR CODE PUBLICLY ON GITHUB! Any code found on GitHub that is not the base template you are given will be reported to SJA. If you want to sidestep this problem entirely, don’t create a public fork and instead create a private repository to store your work.